
When is a “Long Term Economic Plan” not a “Long Term Economic Plan” – when there’s an election coming.
Last November Chancellor Osborne announced spending cuts throughout the next Parliament that would have reduced spending to 35.2% of GDP – which as the OBR pointed out would be the lowest since the 1930s.
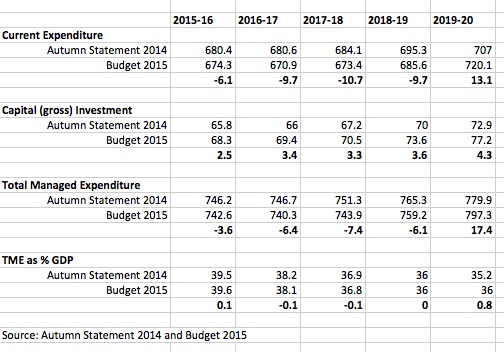
In Budget 2015 the total spending plan for 2019-20 has suddenly jumped – to 36% of GDP (a whole 0.8%).
This has been achieved by a sudden £17.4bn jump in spending in 2019-20 (see below), but a significant drop in spending earlier in the Parliament compared to the Autumn ‘Long Term Plan’.
This extra £17.4bn in 2019-20 looks very much like a deliberate sleight of hand purely to ensure the 35.2% of GDP is tweaked upwards.
The Autumn Statement vs the Budget – when is a Plan not a Plan?
These figures confirm what many have suspected for some time – that the real “Long Term Plan” is about permanently shrinking the size of the public sector. As I have frequently pointed out the long term trend has been for British public spending to be about 42-43% of GDP – roughly in the middle of range of large advanced countries. Going to 36% of GDP is much closer to the lower, Australian and American, end of the spectrum.
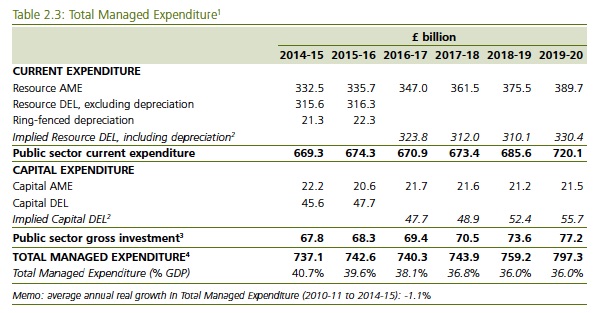
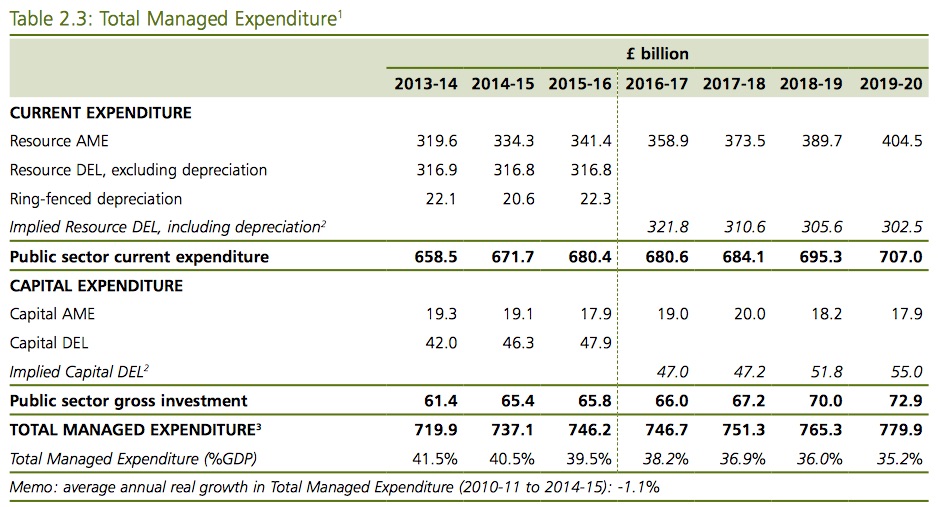
If you want more detail I have reproduced the two relevant original tables from the Autumn Statement and the Budget below.
BUDGET 2015
AUTUMN STATEMENT

One thought on “BUDGET 2015 – The Big Picture on Public Spending”